NOTE: All amounts expressed in millions, unless otherwise stated.
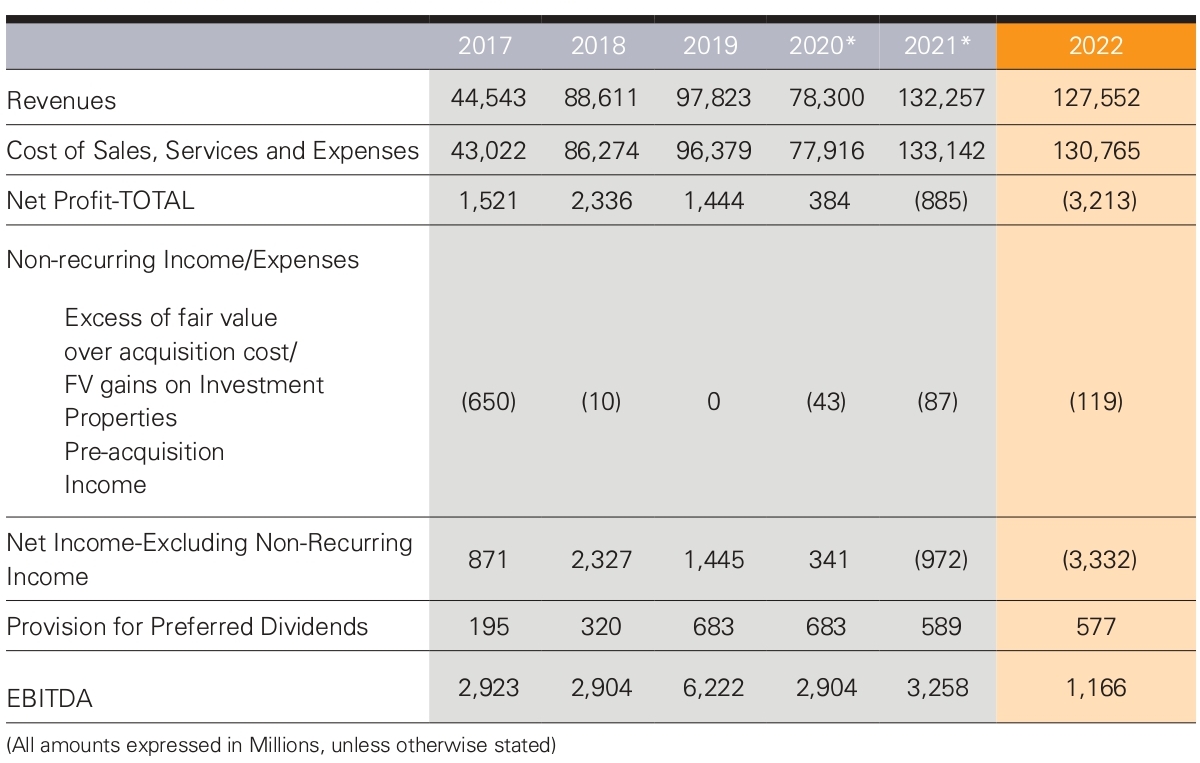
EBITDA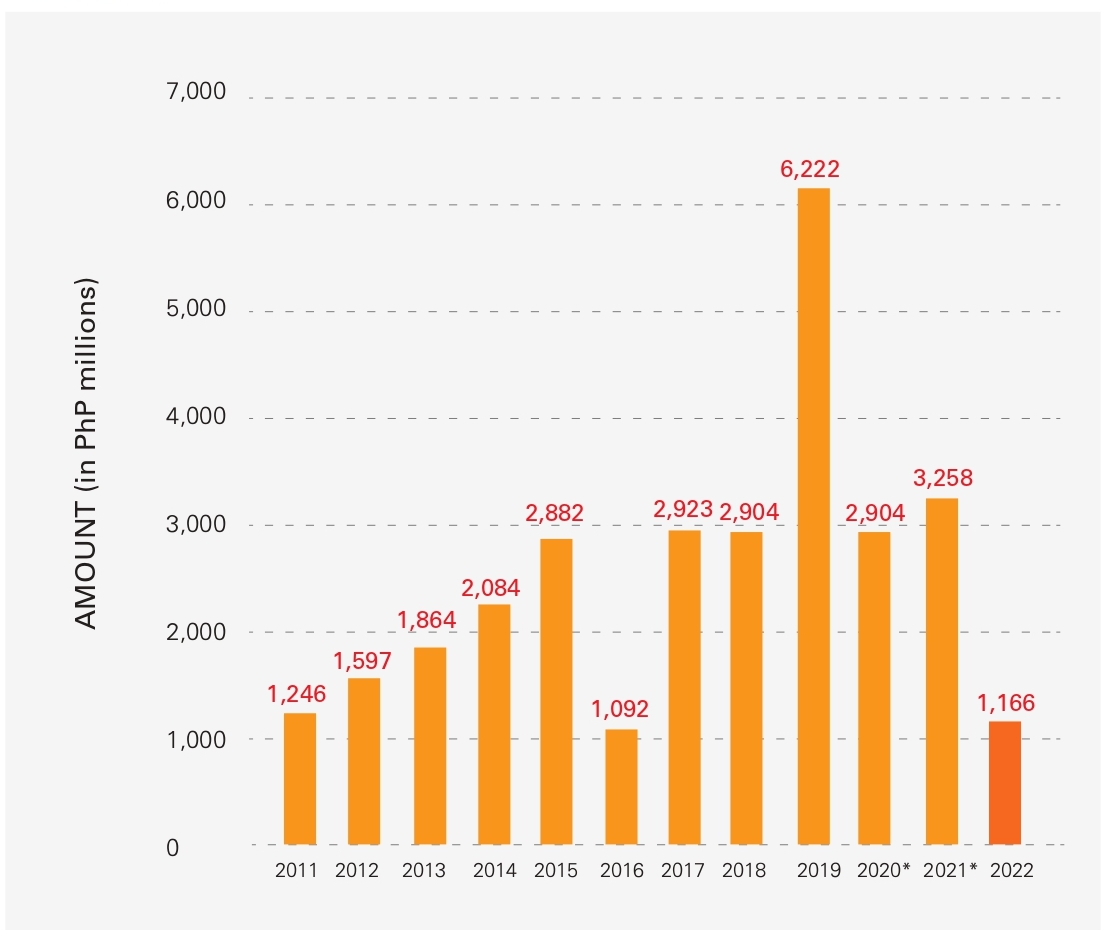
NET PROFIT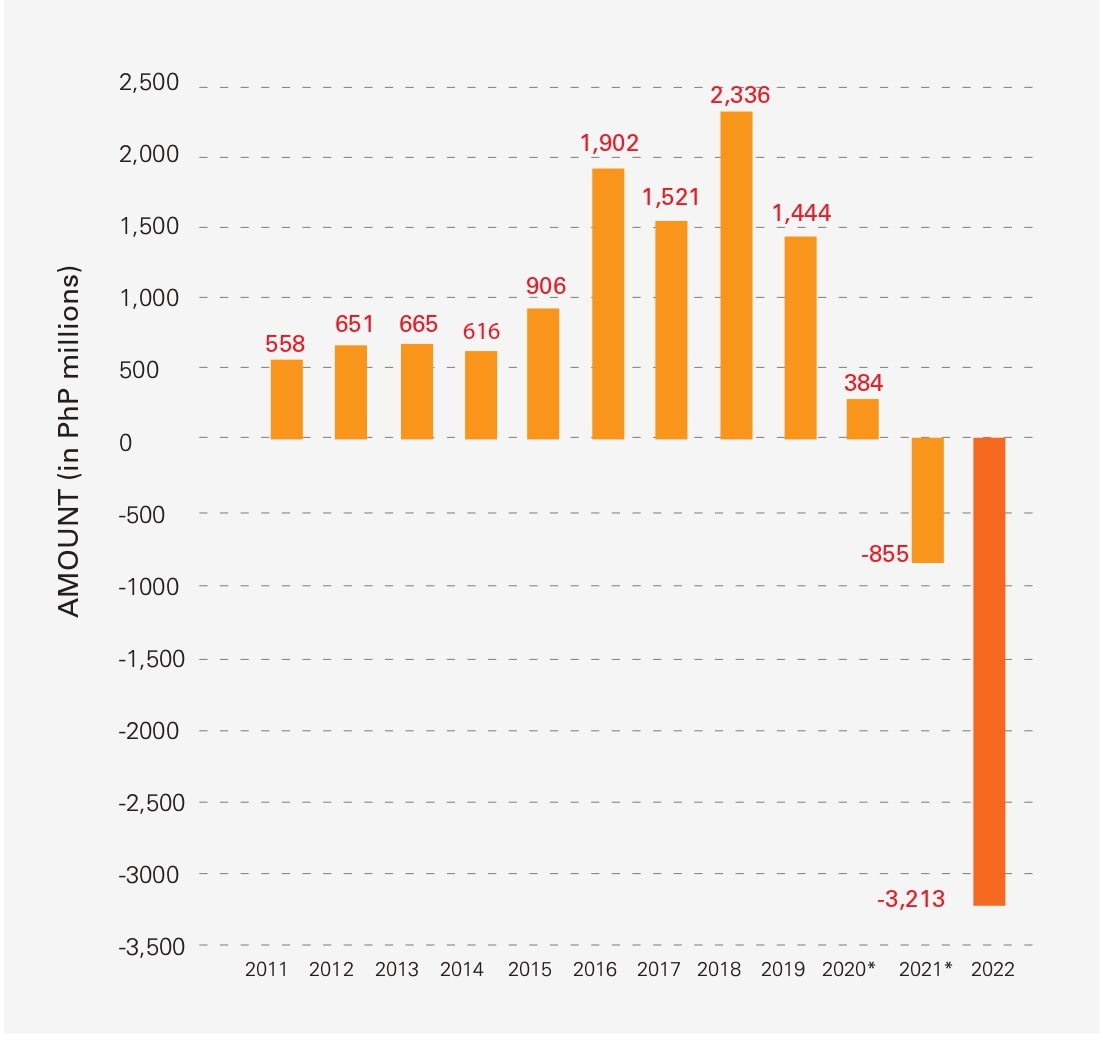
REVENUES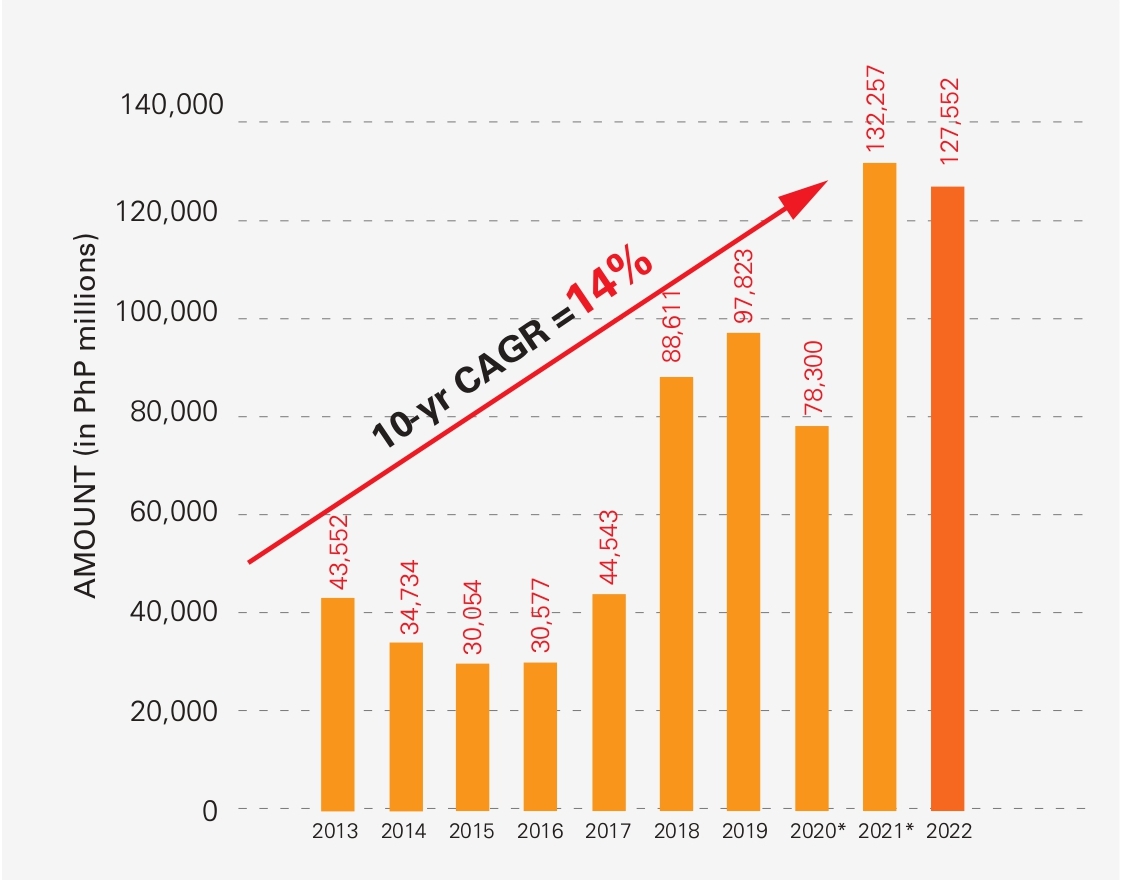
COST OF SALES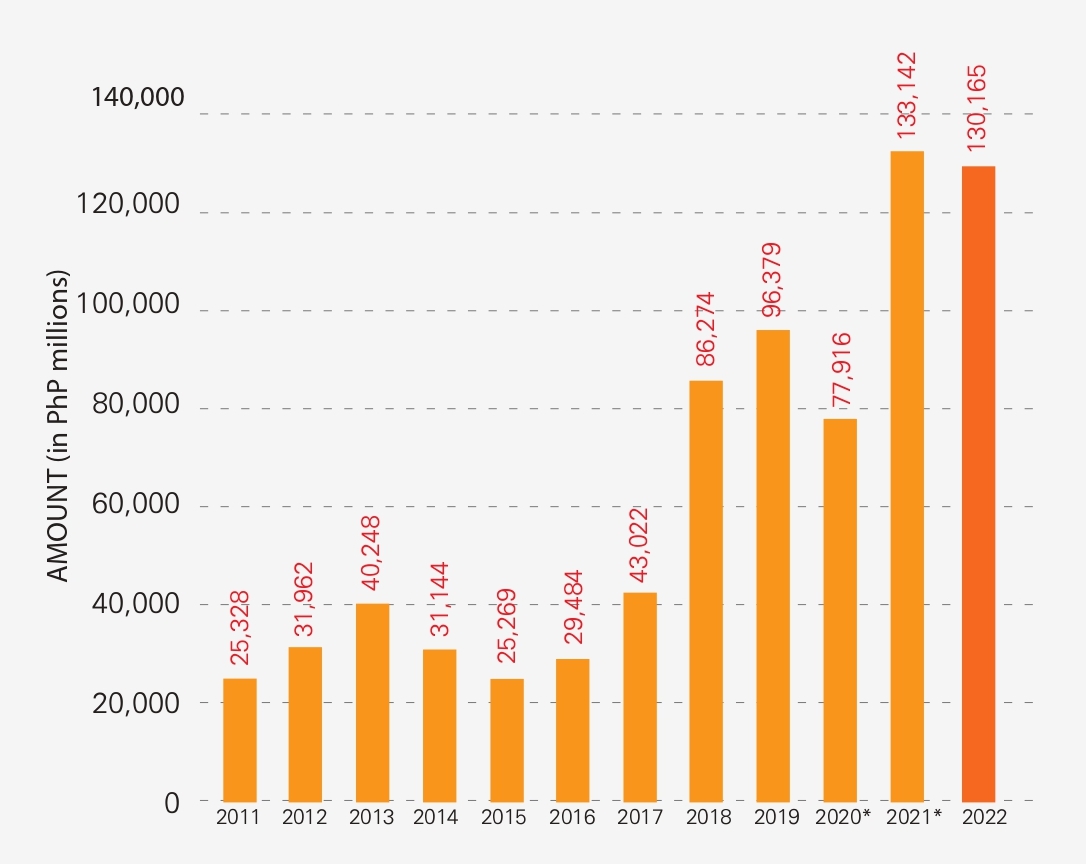
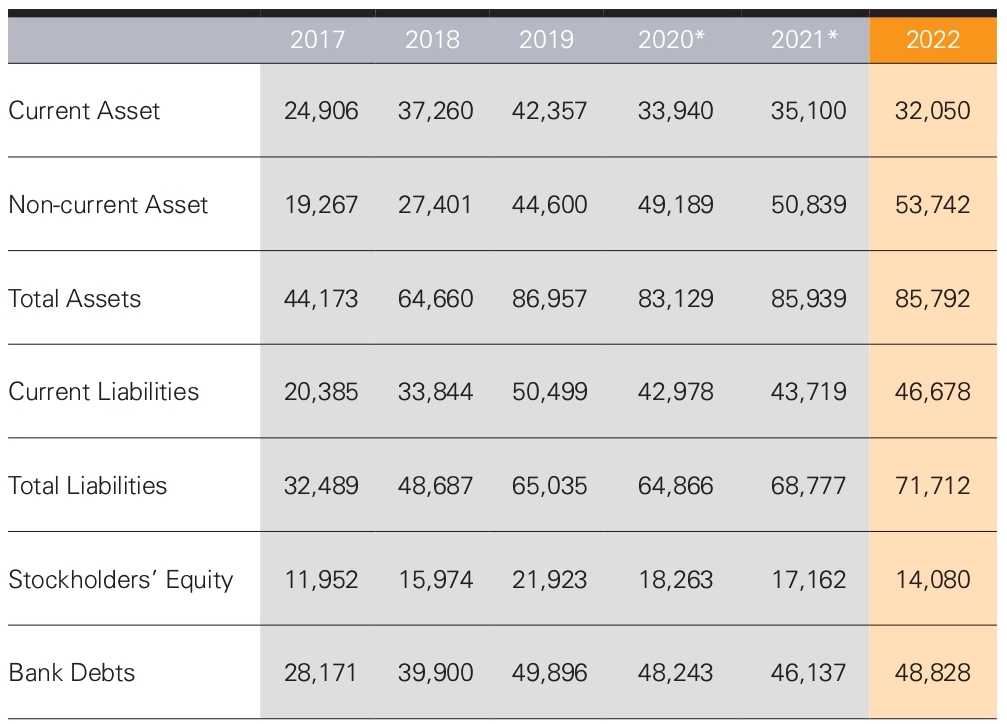
TOTAL ASSETS, TOTAL LIABILITES, AND STOCKHOLDERS' EQUITY
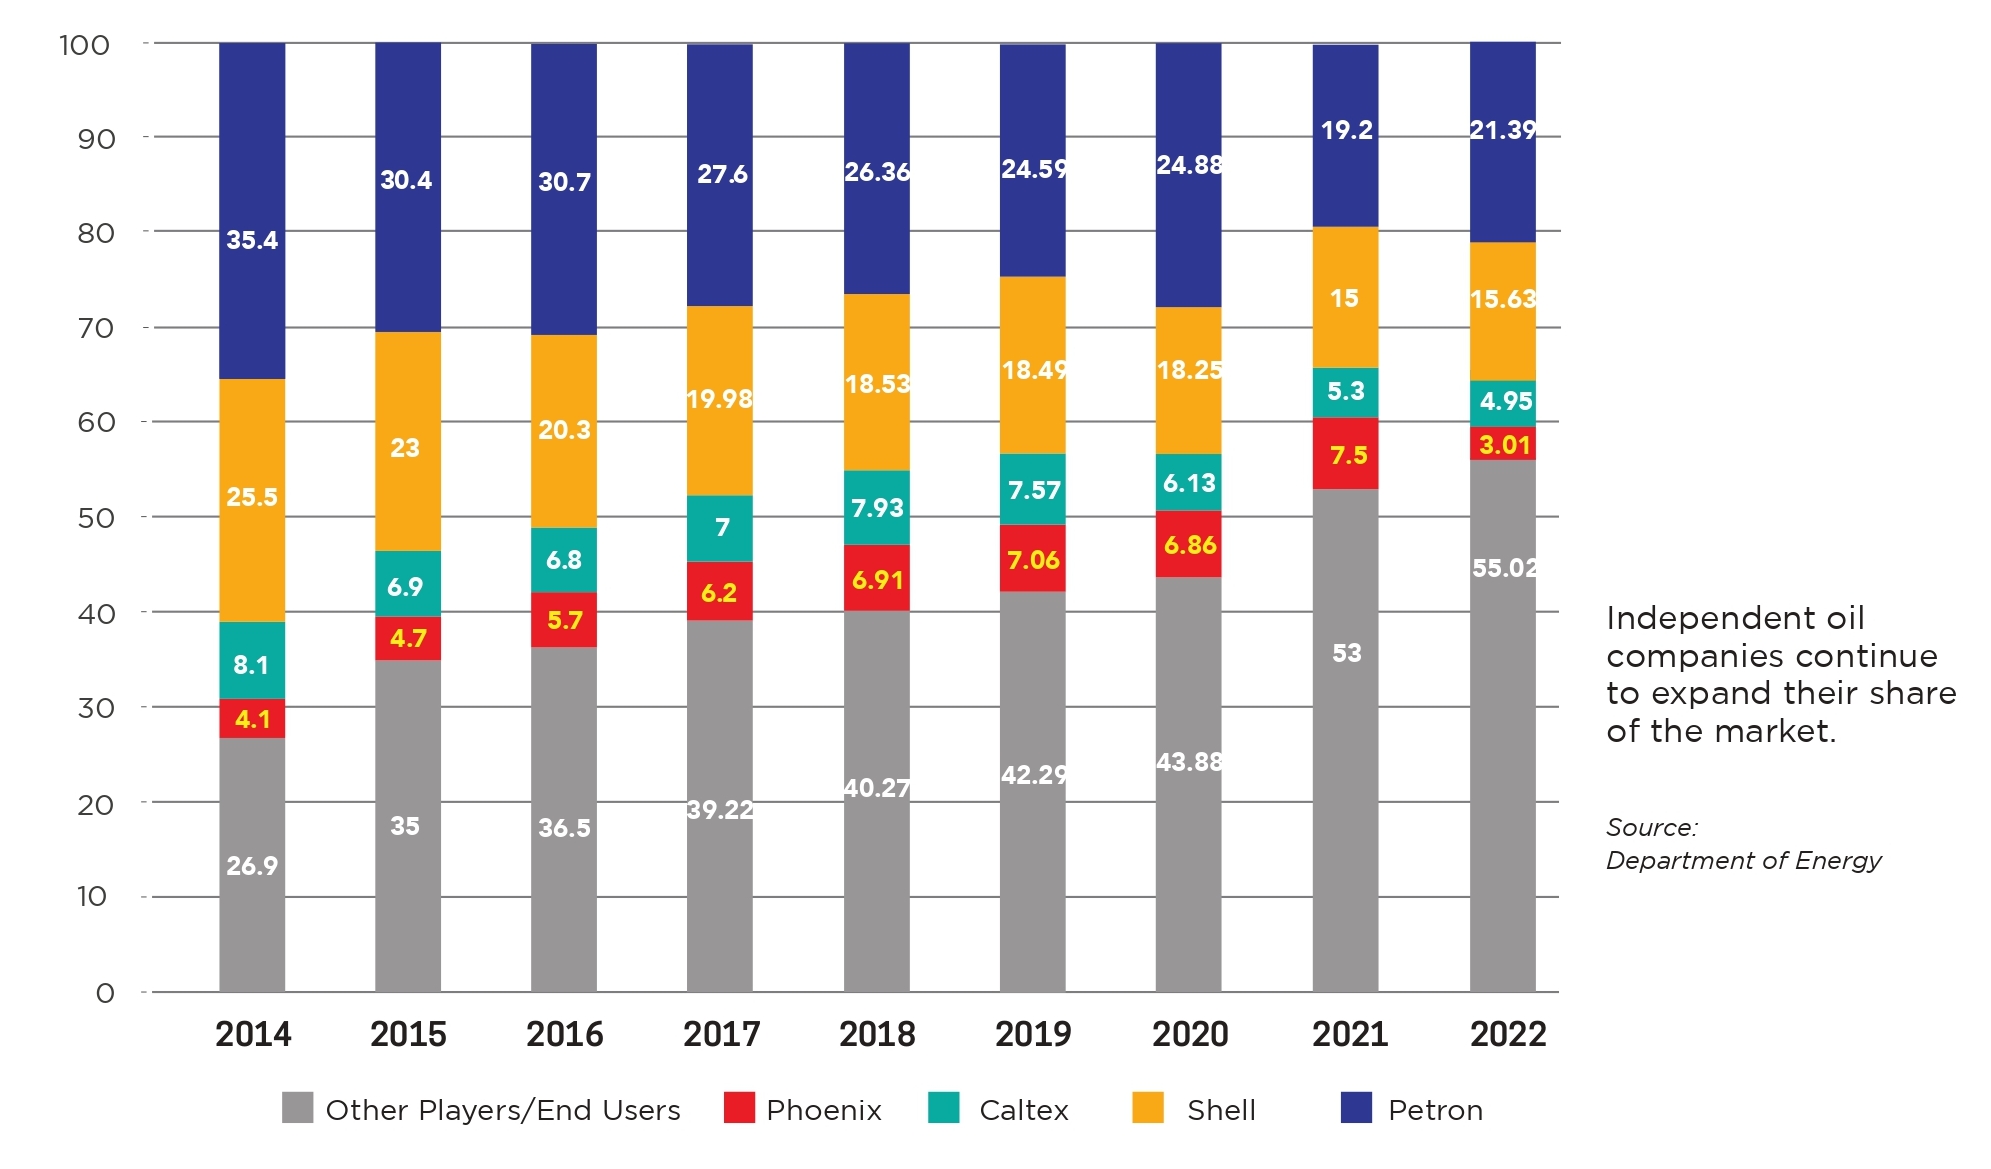
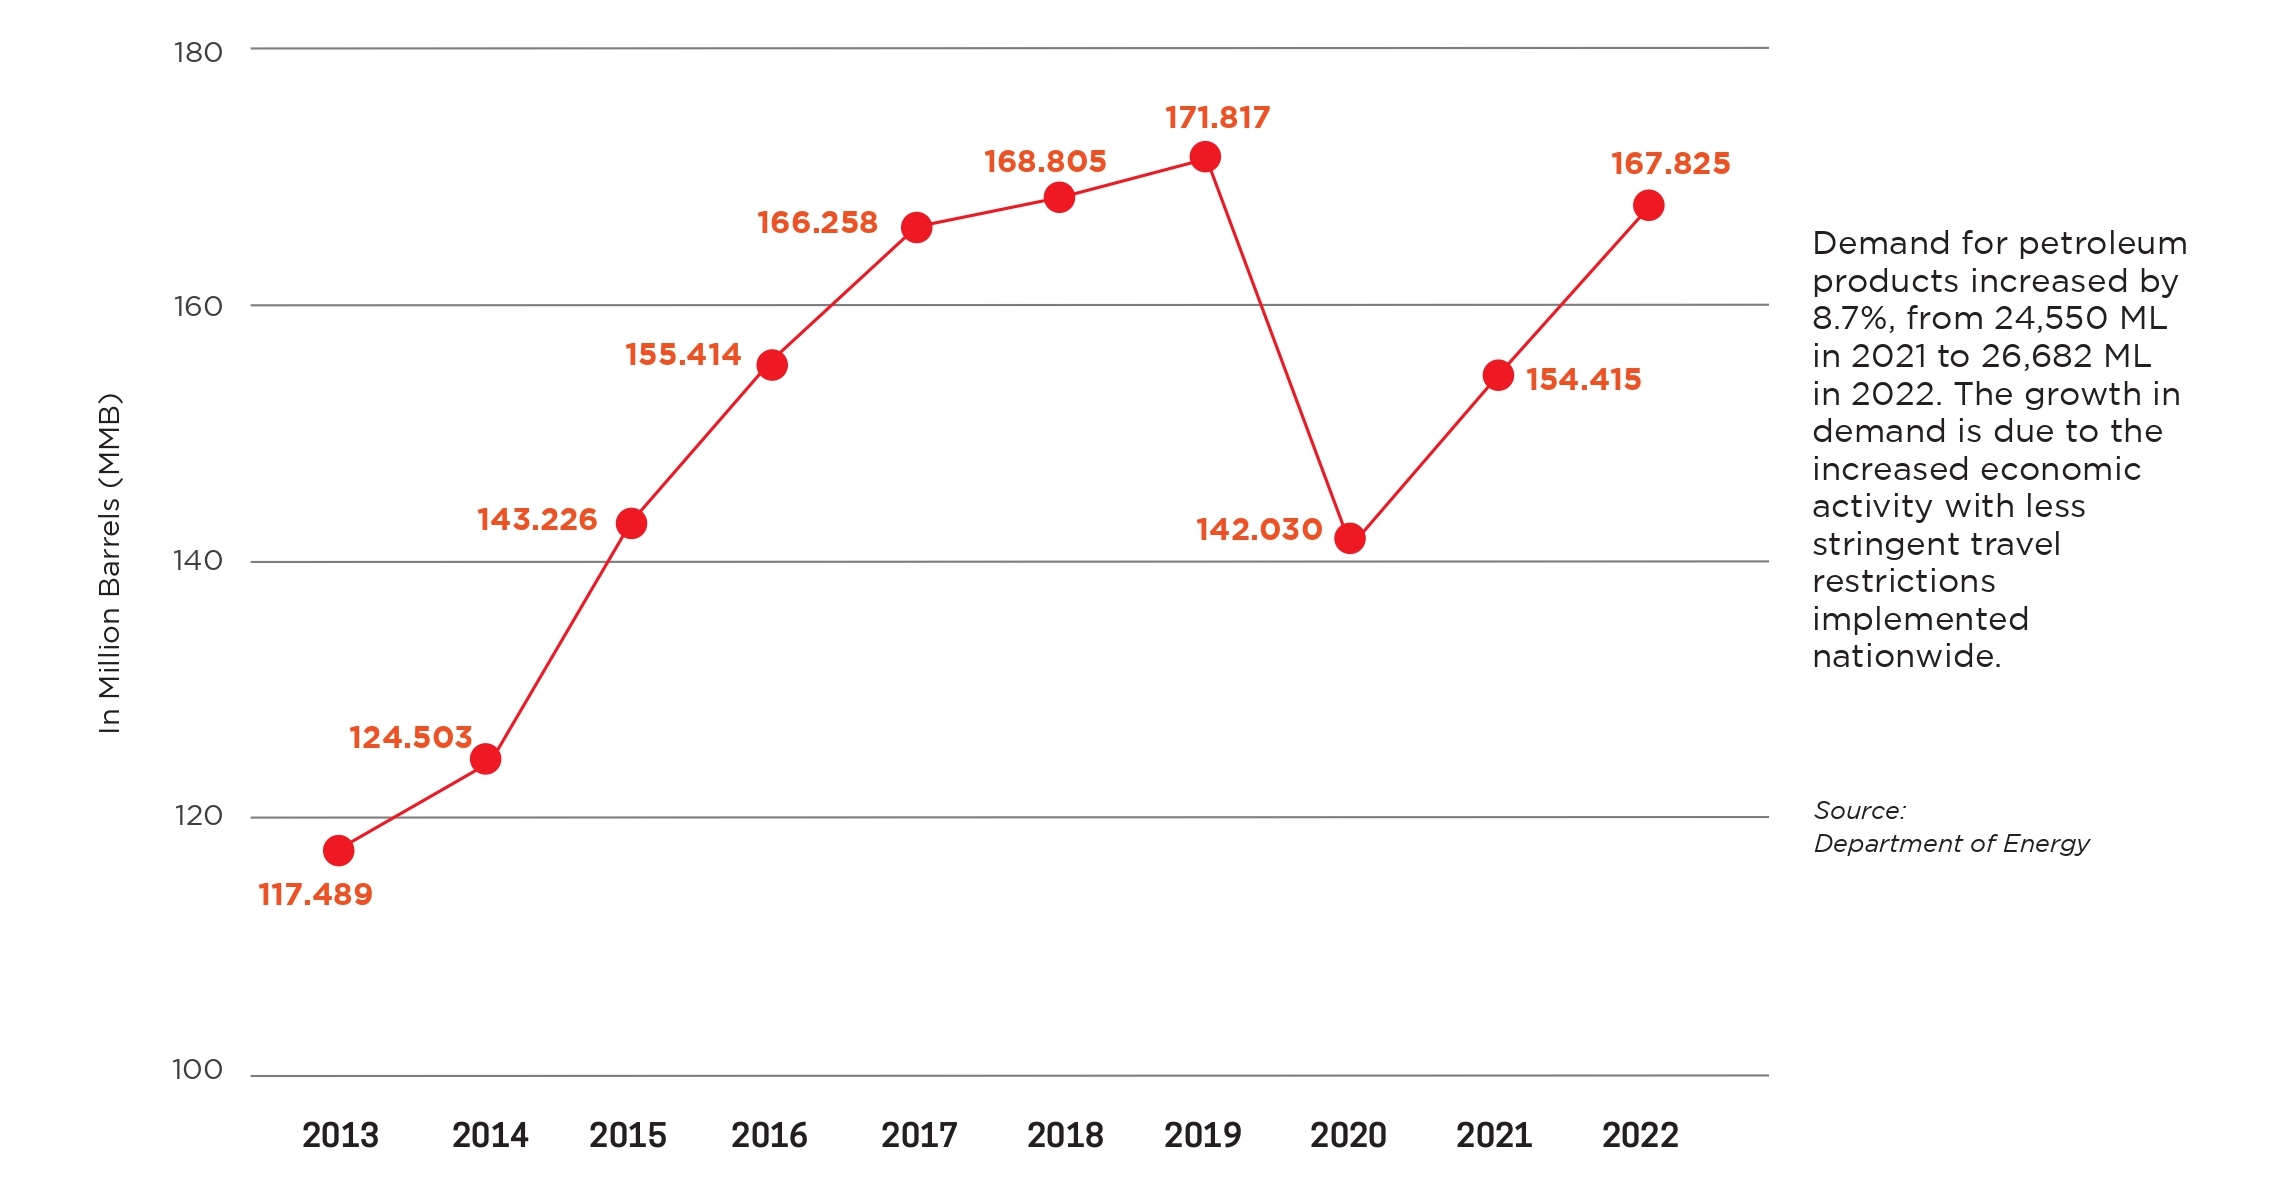
Industry Highlights
MANAGEMENT’S DISCUSSION AND ANALYSIS OF FINANCIAL CONDITION AND RESULTS OF OPERATION
Comparable discussion on Material Changes in Results of Operations for the Year Ended December 31, 2022 vs. December 31, 2021 (as re-stated).
Revenues, Cost of Sales and Gross Margins
The Group’s Revenues during the year 2022 decreased to P127.552 billion, 3.6% lower compared to the restated P132.257 billion generated in 2021. This was mainly due to the 42.3% drop in total volume sold for the comparative years (2022: 2,684.18 million liters vs. 2021: 4,655 million liters) on account of shortfall in working capital. Of the 1,970.82 million liters decline in sales volume, 57.4% or 1,103.29 million liters represented the decrease in volume sold from domestic operations, while 31.7% or 867.53 million liters came from decline in the volume sold by its foreign-based subsidiaries; while the balance of 1,103.29 million liters net decrease or 57.4% is
from domestic operations.
The decline in sales volume was partly offset by the rise in selling price as a result of the 141% spike in the price of Dubai crude (benchmark crude of Asian refineries) average (YTD December 2022 vs 2021: US$96.34/bbl. vs. US$69.39/bbl.) which drove up the prices of refined petroleum products.
Similarly, Cost of Sales and Services decreased by 2.2%, from P124.648 billion in 2021 to P121.865 billion in 2022, principally attributable to decline on sales volume.
The combined effects of the decline in volume and the increase in fuel price contributed to decline in Gross Margin by 25.3% or P1.922 billion.
Operating Expenses, Non-operating Expenses, Recurring Income
The Company’s Selling and Administrative Expenses amounted to P6.080 billion, 7% higher than the P5.681 billion 2021 level, mainly because of the increase in depreciation expenses and necessary repairs and maintenance expenses during the period. Considering the decline in volume, operating expenses per liter increased to P2.35 from P1.22.
Meanwhile, the Company recognized various provisions aggregating P648 million in 2022, P220 million Goodwill impairment, P178 million on Non-Current Asset Held for Sale, and P63 million on Basketball Franchise.
On the other hand, Net Non-operating Charges of P3.089 billion was P447 million lower than the P3.536 billion incurred in 2021. Part of the 12.6% decrease was the P469 million decrease in the finance cost due to reduced volume of trade transactions as well as the P113 million decrease in the equity share in the JV income as a result of losses incurred, partly offset by the P32 million increase in the recognized fair value gains on investment properties and P58 million increase in finance income.
Operating, Net and Comprehensive Incomes
Because of the decrease in volume, the 2022 Operating Income declined by 154% from 2021 Operating Income of P1.928 billion to P1.041 billion Operating Loss. With higher operating expenses and the recognition of impairment losses, the Group incurred a Net Loss After Tax of P3.213 billion in 2022 vis-à-vis the 2021 Net Loss After Tax of P886 million.
On the other hand, the Company recorded a P475 million gain on revaluation of land which was 7% or P29 million higher than P445 million recorded in 2021. In addition, the remeasurement of the post-employment defined benefit program also resulted in a gain of P93 million in 2022, 441% higher than P17 million recognized in 2021. Thus, resulting Comprehensive Loss was recorded at P2.507 billion. This however, was still 366% higher than the P537 million reported loss in 2021.
Financial Condition
(As of December 31, 2022 versus December 31, 2021)
Consolidated resources as of December 31, 2022 stood at P85.792 billion, .17% lower than P85.939 billion level as of December 31, 2021.
Cash and Cash Equivalents decreased by 15% (from P4.903 billion in December 31, 2021 to P4.181 billion as of December 31, 2022) net of the interest paid, loan availments and repayments and short-term placements.
Trade and Other Receivables increased by 1% (from P18.465 billion as of December 31, 2021 to P18.719 billion as of December 31, 2022) due to timing in collections.
Inventory was 72% lower at P1.449 billion as of December 31, 2022 compared to P5.1 billion as of December 31, 2021. This was a result of the Company’s inventory management strategies.
Prepayments and Other Current Assets increased by 17% or P419 million from P2.478 billion in 2021 to P2.896 billion in 2022 mainly due to increase in creditable withholding taxes and security deposit of PNX SG.
Non-Current Asset Classified as Held for Sale was 754% higher at P676 million as of December 31, 2022, from P79 million as of December 31, 2021 coming from reclassification of certain property as Held for Sale.
As of December 30, 2022, the Group’s Property and Equipment, net of accumulated depreciation, decreased to P32.797 billion versus the P33.915 billion as of December 31, 2021. The P1.117 billion or 3% decline is attributable to depreciation recognized for the period and reclassification of certain property to Non Current Asset Held for Sale.
Investment Properties was 33% higher at P914 million as of December 31, 2022, from P687 million as of December 31, 2021. The P226 million increase mainly pertained to the market revaluation of the Company’s real estate properties in compliance with accounting standards.
Intangible Assets was 40% lower at P142 million as of December 31, 2022, from P238 million as of December 31, 2021, as a result of normal amortization.
Right of Use assets decreased to P1.191 billion as of December 31, 2022 from P1.243 billion as of December 31, 2021 resulting from normal depreciation and termination of certain lease agreements.
Investment in Joint Ventures was 7% lower at P1.645 billion as of December 31, 2022, from P1.763 billion as of December 31, 2021 inclusive of the cumulative increase from the equity share in the JVs’ net losses as well as the Company’s share in its new Joint Venture Agreements.
Goodwill decreased by 5% or P220 million from P4.623 billion in 2021 to P4.412 billion in 2022 mainly due to impairment of goodwill of Action Able Inc. and Phoenix Family Mart CVS. Inc.
Deferred Tax Asset was 90% higher at P1.930 billion as of December 31, 2022, from P1.017 billion as of December 31, 2021 coming from reported losses for the year, thereby recognizing Income Tax Benefits.
Other Non-current Assets was 46% higher at P10.711 billion as of December 31, 2022, from P7.344 billion as of December 31, 2021, due to reclassification of certain advances to suppliers from current assets.
Interest-bearing Loans and Borrowings, both current and non-current of P48.828 billion as of December 31, 2022, increased by 6% from P46.137 billion as of December 31, 2021, mainly due to new loan availments for the importation of fuel and debt service.
Trade and Other Payables increased by 2% from P18.903 billion as of December 31, 2021 to P19.285 billion as of December 31, 2022, related to the terms, timing and increased value of purchases of petroleum products.
Lease Liabilities, both current and non current, decreased by 2% from P1.380 billion as of December 31, 2021 to P1.351 billion as of December 31, 2022, due to lease payments.
Other Non-Current Liabilities was 10% lower at P1.246 billion as of December 31, 2022 vs P1.379 billion as of December 31, 2021, coming from reclassification to current portion of Security Deposit and its amortization using the effective interest rate.
Total Stockholders’ Equity decreased to P14.080 billion as of December 31, 2022 from P17.162 billion as of December 31, 2021 (by 18%). The increase in Capital Stock and Additional Paid-in Capital is a result of the ESOP availment.
The restatement of prior years saw a reduction of 163% in Retained Earnings which came from the P3.213 billion Net Loss realized in 2022, payment of dividends on Preferred shares amounting to P0.577. Retained Earnings is net of restatement from prior years as a result of the following: (1) change in the Group’s accounting policy to measure the cost of its fuels and by products and LPG inventories from weighted average cost to first-in first-out (FIFO) method; (2) recognition of previously unrecognized right-of-use assets and lease liabilities from periods 2019 to 2021 for several leases related to store outlets of PFM; (3) accrual of various expenses amounting to P106.7 million as of December 31, 2021; and (4) the reclassification to Trade and Other Receivables - net account of advances to certain supplier amounting to P3,209.7 million, which was previously recognized as deduction from the Trade and Other Payables account, and recognition of allowance for impairment on the full amount of the advances as of January 1, 2020, which is the beginning of the earliest period presented.
The decline in Retained Earnings is partially offset by the increase in the Revaluation Reserves of P0.0639 billion coming from the Other Comprehensive Income component of the Fair Value Gains of certain assets and currency translation of foreign subsidiaries’ financials.
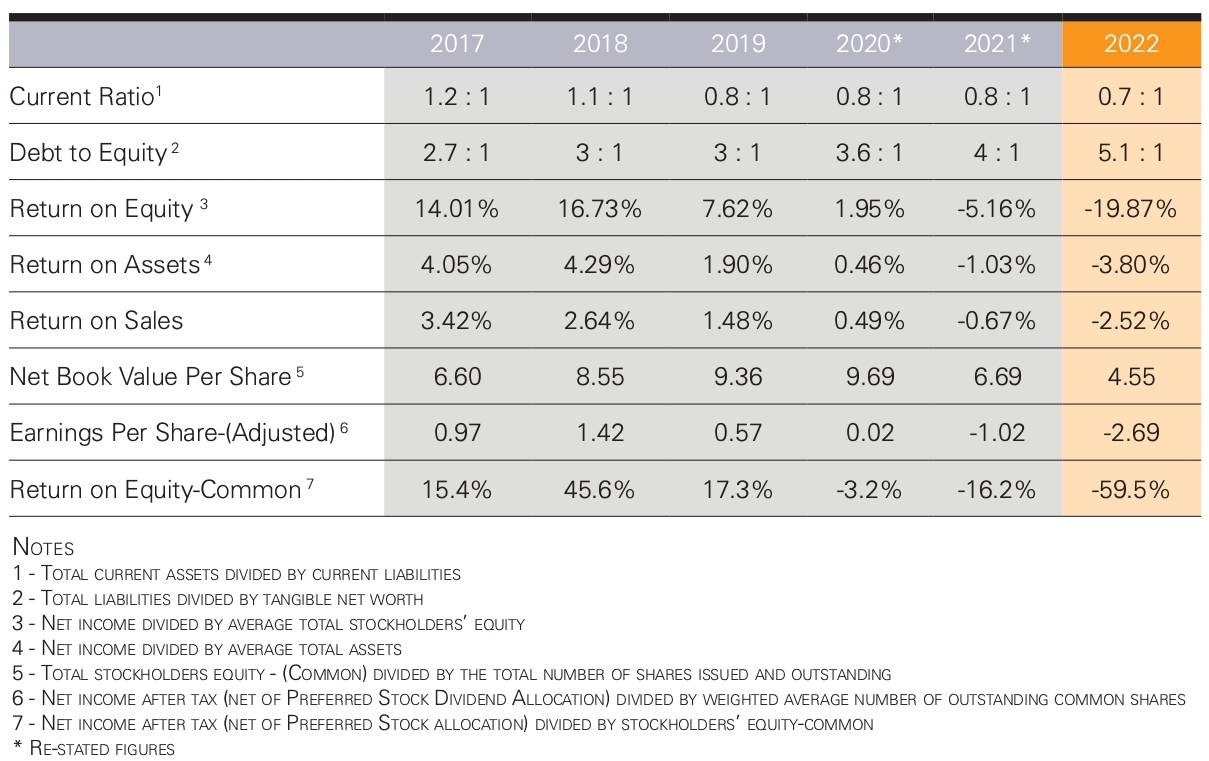
The Group’s key performance indicators and relevant ratios, and how they are computed are listed below:
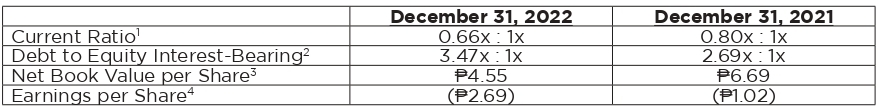
2 - Interest Bearing Debts divided by Total stockholder’s equity
3 - Total stockholder’s equity (net of Preferred) divided by the total number of shares issued and outstanding
4 - Period or Year net income after tax divided by weighted average number of outstanding common shares
Got questions?
For inquiries from analysts, the financial community, and institutional investors, contact Phoenix Petroleum Philippines, Inc. through:
Head office
Phoenix Bulk Depot,
Lanang, Davao City
Philippines
Trunkline: (082) 235-8888
Fax: (082) 233-0168
Manila office
15th to 17th Floors, Udenna Tower,
Rizal Drive cor. 4th Avenue,
Bonifacio Global City, Taguig,
Metro Manila, Philippines
Trunkline: (02) 8403-4013
Fax: (02) 8403-4021
Or you may also send us an email at info@phoenixfuels.ph